RNAimmuno - Statistics
- Statistics
- Reagent
- Delivery
- Sensor
- Responder
- Model

|
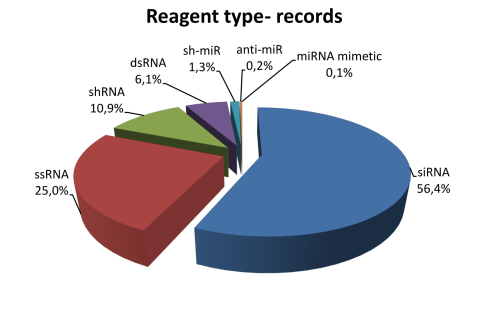
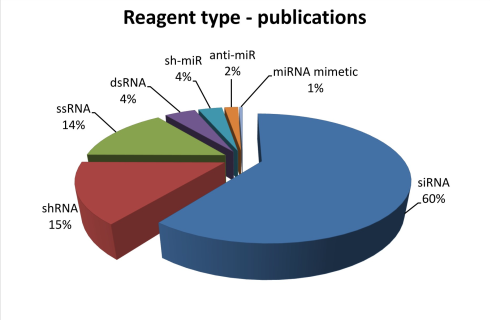
The statistics of RNAimmuno records classified into the main search categories. The presented values are the absolute number of records within a specific category type. The presented data concerns the most frequent subcategories of search (the less frequent subcategories are shown as "other").
|
|
|
|
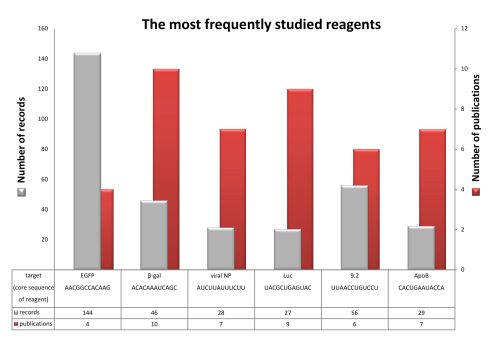
The statistics of RNAimmuno records shown as a percentage of data within a specific category of the searches results (Reagent type). Some siRNAs and their modified versions (the list of top 6 is presented) were studied by different authors. Number of publications and database records in which specific siRNAs were analyzed is indicated with red and gray colour respectively.
|
|
|
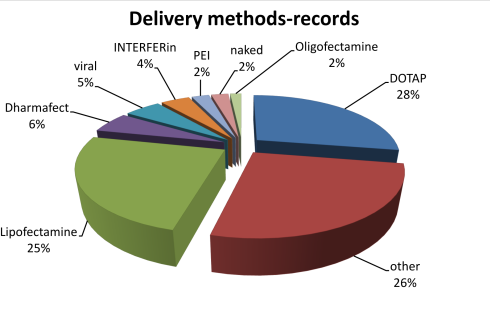
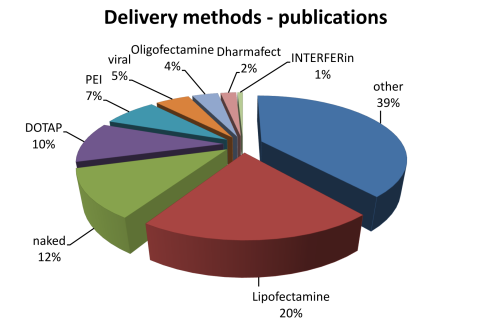
The statistics of RNAimmuno content shown as a percentage of records or as a number of publications within a specific category of the search results (Delivery method).
|
|
|
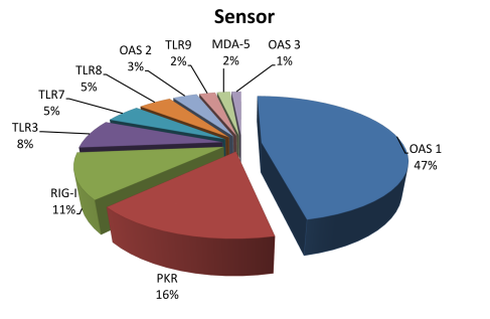
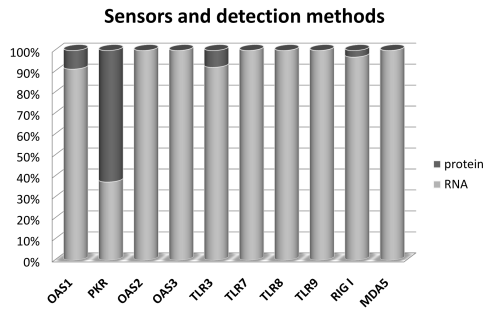
The statistics of RNAimmuno records shown as a percentage of data within a specific category of the searches results (Sensor). We have also shown detection methods, classified into two main categories: analysis of protein and transcript level.
|
|
|
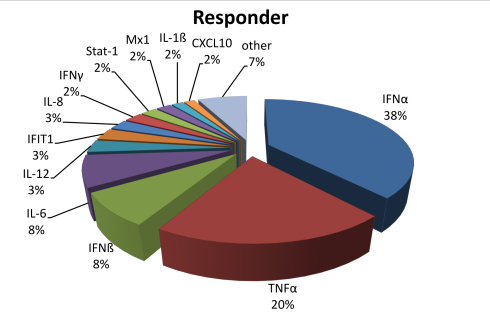
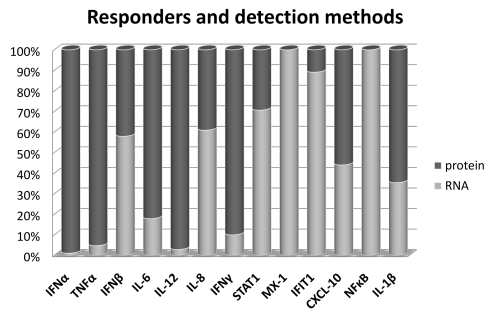
The statistics of RNAimmuno records shown as a percentage of data within a specific category of the searches results (Responder). We have also shown detection methods, classified into two main categories: analysis of protein and transcript level.
|
|
|

|
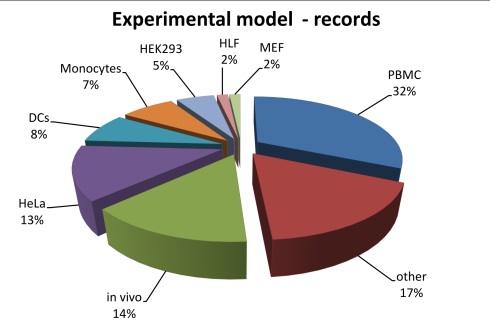
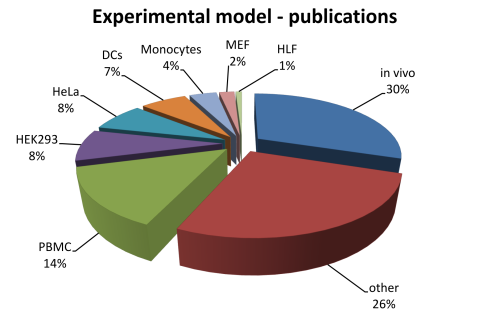
The statistics of RNAimmuno content shown as a percentage of records or as a number of publications within a specific category of the search results (Experimental model). Pattern of analysed sensors and responders differs between experimental models: immune cells (PBMC, DC, monocytes, macrophages, NK cells, B cells, T cells), non-immune cells (HeLa, HEK, MCF7, MRC, PC12, HT180, Huh7, IGROV-1, T98G, HUVEC, fibroblasts,) and in vivo.
|